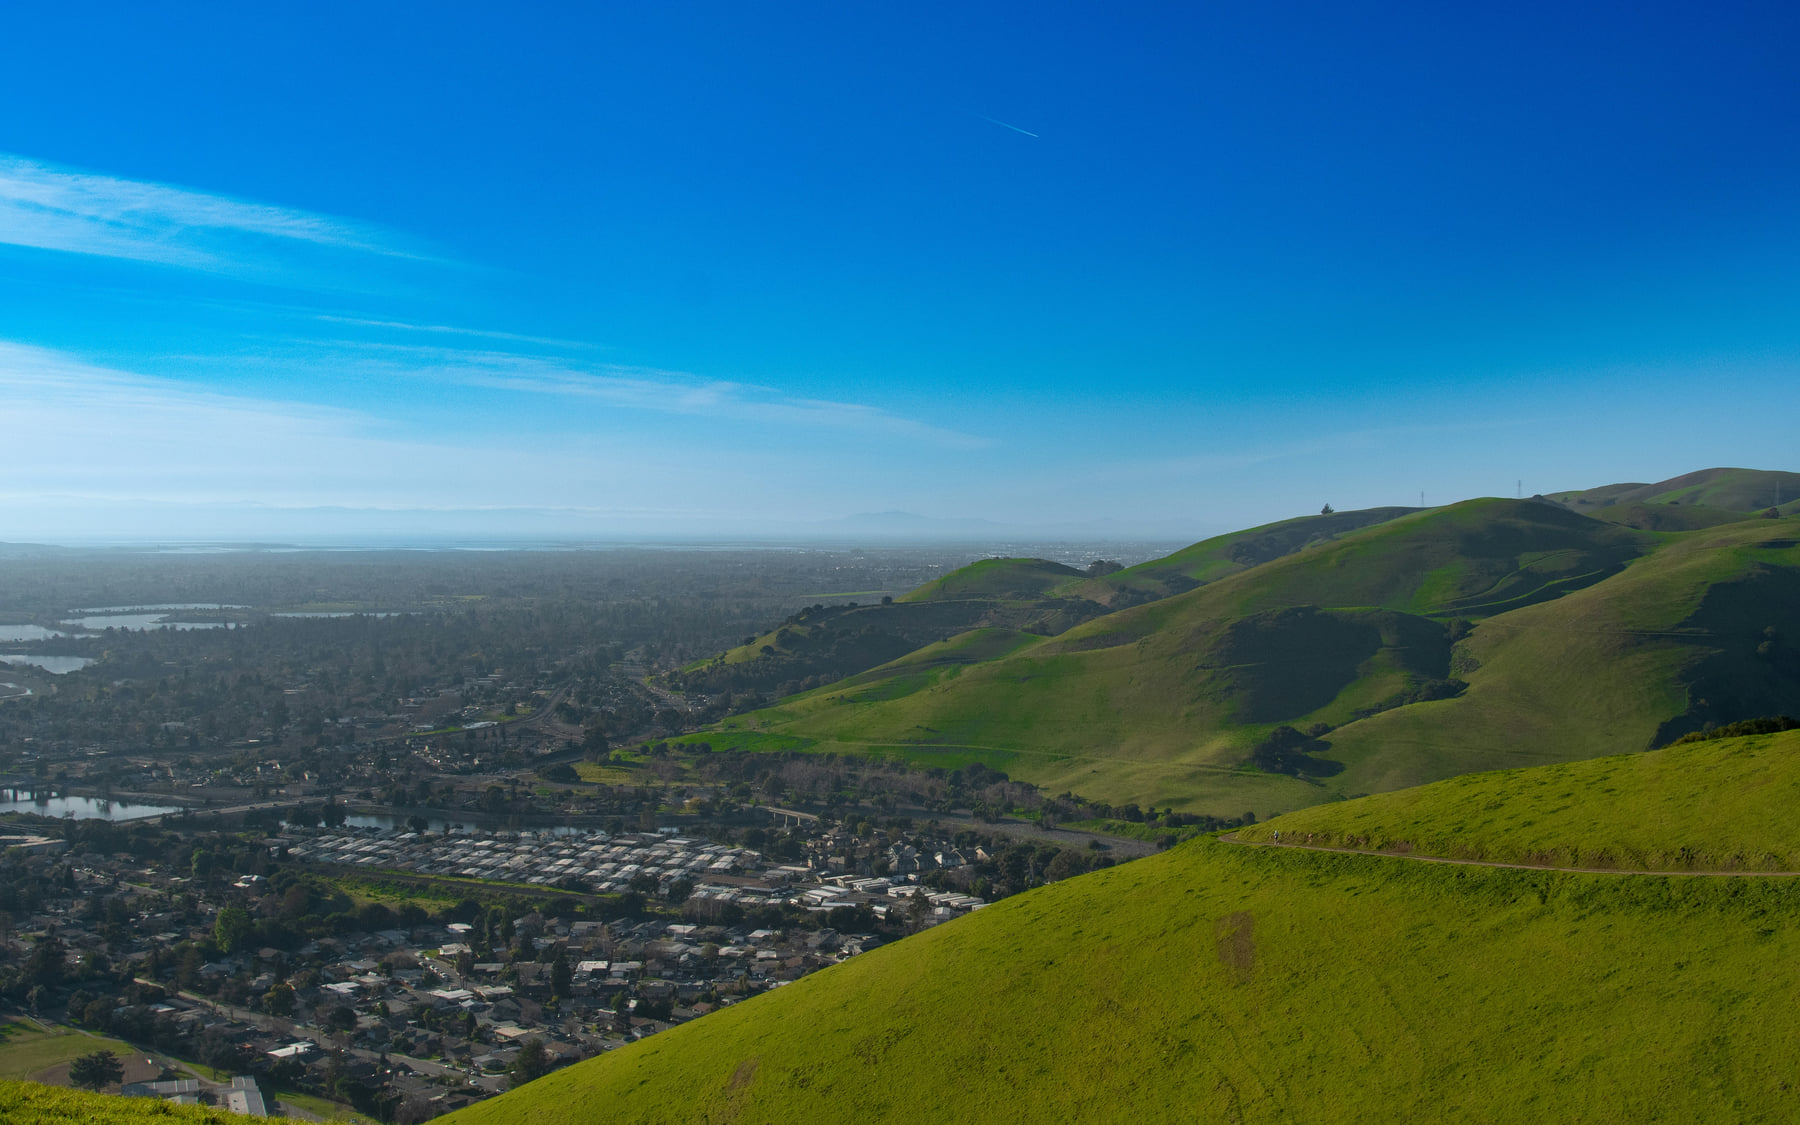
Fremont seen from the green hills of Vargas Plateau Regional Park, with the city spreading out toward the Bay
94536 · 94538 · 94539 · 94555

Fremont, CA Home Values By Zip Code

Home value

What’s Your Fremont Home Worth?

In Warm Springs, see an instant value range now, with the 3 recent sales behind it. Anywhere else in Fremont, I’ll price your home personally. Want the in-depth report? Leave your email or phone.

Home type

The instant range covers single-family homes in Warm Springs for now. Own a townhome or condo, or a home elsewhere in Fremont? I’ll price it personally.

No email needed to see a Warm Springs range.

Fremont is one city, but it sells like several. In the past 12 months, 854 single-⁠family homes sold here at an average of $1,941,142, 1.1% higher than the year before, at $1,066 per sq ft. Almost two in three (64.5%) sold above asking, after an average of 19 days on market.

Where you are matters: the average runs from $1,462,559 in 94538 to $2,691,410 in 94539. That’s why my estimates start from the most similar recent sales near your home: instantly in Warm Springs for now, and personally anywhere else in Fremont. Curious what yours would sell for? Start with the form at the top of this page.

The home value tool

How Your Home Value Works

Get Your Home Value
  1. Enter Your Address

    Just your street address to start.

  2. Instant in Warm Springs

    There, your range shows right away, with a confidence level and the 3 recent sales it’s based on. No email needed. Anywhere else in Fremont, I’ll price your home personally.

  3. Get the In-Depth Report

    Leave your email or phone, and the report is shared with you within 24 hours.

Market data

Fremont Price Tracker

854 single-family sales from October 2025 to September 2026, against the 12 months before. Below, a small version of my Fremont price tracker, with every sale since January 2020, citywide or by zip code.

Open the full Fremont price tracker
Average sold price
$1,941,142
Up 1.1% from $1,919,841
Average price per sq ft
$1,066
Down 2.9% from $1,098
Sold over list price
3.6%
64.5% sold above asking
Average days on market
19 days
2 days slower than the year before (17)
Typical home
3 bd · 1,857 sq ft
Most common: 3 bd / 2 ba. Averages: 7,912 sq ft lot, built 1972
Zip code
Metric
Range
Average sold price · All Fremont · Quarterly, Q1 2020 to Q3 2026: $1,836,300 in Q3 2026, Up 32.6% from Q1 2020
Average sold price · All Fremont · Q3 2026
$1,836,300Up 32.6%from Q1 2020
High in range
$2,045,916 Q2 2026
Low in range
$1,301,463 Q2 2020
Sales, latest period
236 Q3 2026
Q3 2026 vslast quarter-10.2%6 months ago-2.7%1 year ago-4.1%
All Fremont$1,836,300
Average sold price
Sales per quarter, All Fremont

Fremont had 854 single-family sales in the past 12 months, about 70 a month, so the citywide line is steady month to month; a single zip code moves more, so its quarterly view reads better. Data runs January 2020 through September 30, 2026, so Q3 2026 is a complete quarter.

Show the numbers: quarterly data, All Fremont (27 periods)

Newest first. Tap a period to see its sales, or download them as a CSV file.

Period
Avg Price
$/Sq Ft
Sales
Avg Size
Chg ($)
$1,836,300$1,0342361,795 sq ft-$209,616
$2,045,916$1,0752671,952 sq ft+$159,293
$1,886,623$1,1051521,748 sq ft-$79,923
$1,966,546$1,0611991,886 sq ft+$52,434
$1,914,112$1,0492441,860 sq ft-$16,244
$1,930,356$1,1102541,804 sq ft-$8,490
$1,938,846$1,1411511,745 sq ft+$37,834
$1,901,012$1,1072201,760 sq ft-$75,489
$1,976,501$1,1102331,815 sq ft-$50,241
$2,026,742$1,1222731,894 sq ft+$133,199
$1,893,543$1,0701891,827 sq ft+$148,324
$1,745,219$1,0061841,788 sq ft-$54,521
$1,799,740$9942191,861 sq ft+$50,866
$1,748,874$9892061,810 sq ft+$170,135
$1,578,739$9231451,760 sq ft+$12,158
$1,566,581$9061961,766 sq ft-$106,197
$1,672,778$9442731,807 sq ft-$265,368
$1,938,146$1,0763381,864 sq ft-$11,891
$1,950,037$1,0572321,914 sq ft+$252,049
$1,697,988$9703331,798 sq ft+$27,995
$1,669,993$9084741,888 sq ft+$48,245
$1,621,748$8934181,882 sq ft+$112,803
$1,508,945$8172731,928 sq ft+$129,632
$1,379,313$7743141,854 sq ft+$19,852
$1,359,461$7313761,926 sq ft+$57,998
$1,301,463$7302041,856 sq ft-$83,036
$1,384,499$7311971,960 sq ftn/a
Neighborhoods

Explore Fremont By Zip Code

Each zip code gets its own page, and each zip code page leads to its neighborhood guides. Warm Springs is the first guide live.

Average sold price, past 12 months (bar starts at $0)Fremont average, $1,941,142
  • Fremont 94536

    Zip code page coming soon
    Average sold · 299 sales
    $1,683,900
    Down 1.3% from $1,705,890
    $1,002 per sq ft · 20 days on market
    See 94536 in the tracker
    Neighborhoods
    • NilesGuide coming soon
    • CentervilleGuide coming soon
    • Central FremontGuide coming soon
    • BrookvaleGuide coming soon
  • Fremont 94538

    Zip code page coming soon
    Average sold · 188 sales
    $1,462,559
    Down 4.1% from $1,525,003
    $1,021 per sq ft · 21 days on market
    See 94538 in the tracker
    Neighborhoods
    • IrvingtonGuide coming soon
    • South FremontGuide coming soon
  • Fremont 94555

    Zip code page coming soon
    Average sold · 130 sales
    $1,857,111
    Down 0.7% from $1,870,495
    $1,049 per sq ft · 18 days on market
    See 94555 in the tracker
    Neighborhoods
    • ArdenwoodGuide coming soon
    • NorthgateGuide coming soon
Zip code map

The Four Zip Codes on a Map

Here’s where each zip code sits. Shade the map by price, price per square foot, the change from last year or days on market, and pick a zip code to see all of its numbers.

Shade the map by
Average sold price, past 12 monthsDarker = higher
$1.25M$2.75M
Fremont average, $1,941,142
Warm Springs guide
All of Fremont
Pick a zip code on the map

Fremont, All Four Zip Codes

854 sales, October 2025 to September 2026
Average price
$1,941,142
Past 12 months
$ per sq ft
$1,066
Down 2.9% from $1,098
Change vs last year
Up 1.1%
From $1,919,841
Days on market
19 days
17 days the year before

Sold 3.6% over list price, and 64.5% sold above asking. Average home: 1,857 sq ft, built 1972.

See the map’s numbers as a table
Fremont's four zip codes, past 12 months (October 2025 to September 2026), single-family sales
Zip codeSalesAverage price$ per sq ftChange vs last yearDays on market
94536299$1,683,900$1,002Down 1.3%20 days
94538188$1,462,559$1,021Down 4.1%21 days
94539237$2,691,410$1,191Up 4.7%16 days
94555130$1,857,111$1,049Down 0.7%18 days
All of Fremont854$1,941,142$1,066Up 1.1%19 days

The same 12 months of single-family sales as the cards above, counted by each home’s zip code in the MLS. The zip code areas are the Census Bureau’s outlines, so a street on an edge can get its mail through the neighboring zip code. Zip areas: US Census 2020 ZIP Code Tabulation Areas, clipped to the City of Fremont limit. Neighborhoods: City of Fremont.

Questions

Common Questions About Fremont Home Values

How accurate is the instant estimate?

It’s a starting point, not an appraisal: an automated estimate from recent single-family sales near you and your home’s facts, for Warm Springs homes so far. It can’t see condition, updates or layout, so the optional questions after your range sharpen it, and my in-depth report looks at the home itself.

Does it work for condos and townhomes?

The instant estimate is for single-family homes in Warm Springs so far. Choose Townhome or condo in the form, or enter any other Fremont address, and I’ll price yours personally.

What’s the average home price in Fremont?

$1,941,142 for the 854 single-family homes that sold in the past 12 months (October 2025 to September 2026), 1.1% higher than the 12 months before. By zip code it runs from $1,462,559 in 94538 to $2,691,410 in 94539.

How fast do Fremont homes sell?

In the past 12 months, an average of 19 days on market (2 days slower than the year before). 64.5% sold above asking, and in total homes sold 3.6% over list.

Which zip codes does this page cover?

Four Fremont zip codes: 94536, 94538, 94539 and 94555. The price tracker above can show each one on its own.

Want the Numbers Every Month?

My monthly market update covers what sold and for how much.

Get the monthly market update

About the Data and Sources

Detached single-family sales from the Bay East Association of REALTORS® MLS (deemed reliable but not guaranteed), compiled by Josh Uy, with data through Sept 30, 2026. Townhomes and condos aren’t included. Fremont = every sale in zip codes 94536, 94538, 94539 and 94555 in my Fremont price tracker, except one 221-acre ranch and two condos recorded as houses. A sale entered twice in the MLS counts once (same home and sold price, closed within 7 days, or the same listing entered twice); where the two records disagree on the price, I use the price I confirmed.

Averages unless noted: sold price, days on market, sq ft and lot are plain averages (means) of the sales, and average $/sq ft is the mean of each sale’s MLS price per sq ft. An average lot leaves out lots recorded as 0 or blank, and the shared lots: some newer terrace homes carry a lot shared by several homes in the records, not their own yard. Beds and baths are the most common count; year built is the average, rounded. Averages move with a few large or small sales, so read single months and quarters loosely.

“Above asking” = the share of sales with a sold price above list. “Sold over list” = total sold ÷ total list, minus 1. Past 12 months = Oct 1, 2025 to Sept 30, 2026; changes compare with Oct 1, 2024 to Sept 30, 2025.

Price tracker: every Fremont sale since January 2020, by month or quarter, citywide or by zip code; avg size is the mean sq ft. The Warm Springs overlay is the City of Fremont’s Warm Springs neighborhood (west of I-⁠680). SPY and QQQ are month-end closes and the 30-year rate is the monthly average of Freddie Mac’s weekly rate, both from my Fremont price tracker; a quarter uses its last month. With any overlay on, every line is indexed to 100 at the start of the range. Trend lines are exponential moving averages over 6 or 12 months.

The instant estimate is the Warm Springs home value model (single-family homes in the City’s Warm Springs neighborhood).

Sources (5)